Skip to contents

[Experimental]

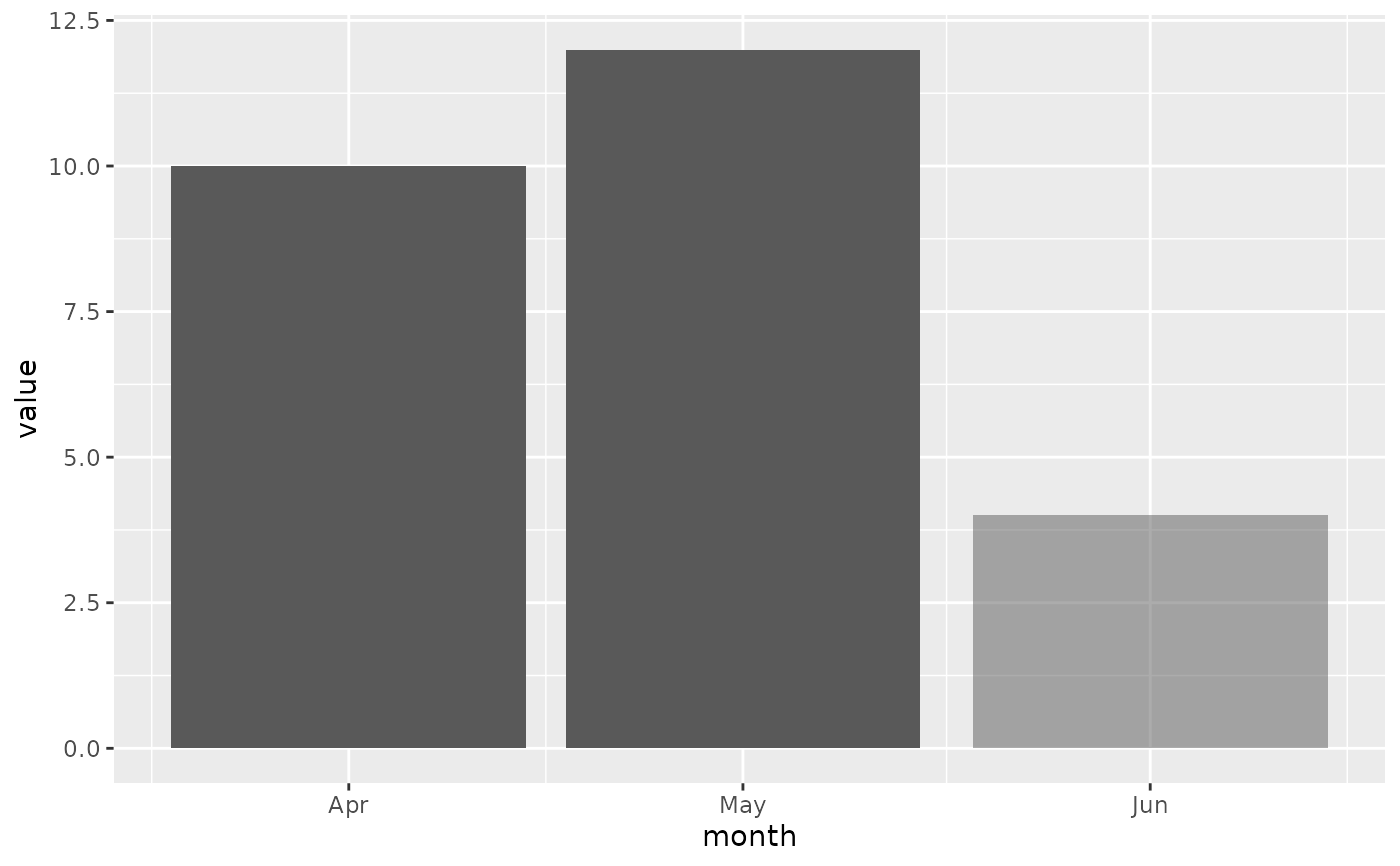
A manual alpha scale mapping FALSE/TRUE to two opacity levels, with the guide hidden. Pairs with period_is_complete() to fade the in-progress period in bar or column charts, e.g. ggplot2::aes(alpha = period_is_complete(date, as_of = cutoff)).
Usage

scale_alpha_logical(false_alpha = 0.5, true_alpha = 1)

Arguments

false_alpha

Alpha applied to FALSE (incomplete) values. Defaults to 0.5.

true_alpha

Alpha applied to TRUE (complete) values. Defaults to 1.

Value

A ggplot2 scale object.

Examples

library(ggplot2)
df <- data.frame(
  month = as.Date(c("2025-04-01", "2025-05-01", "2025-06-01")),
  value = c(10, 12, 4)
)
ggplot(df, aes(month, value,
  alpha = period_is_complete(month, as_of = as.Date("2025-06-15"))
)) +
  geom_col() +
  scale_alpha_logical()